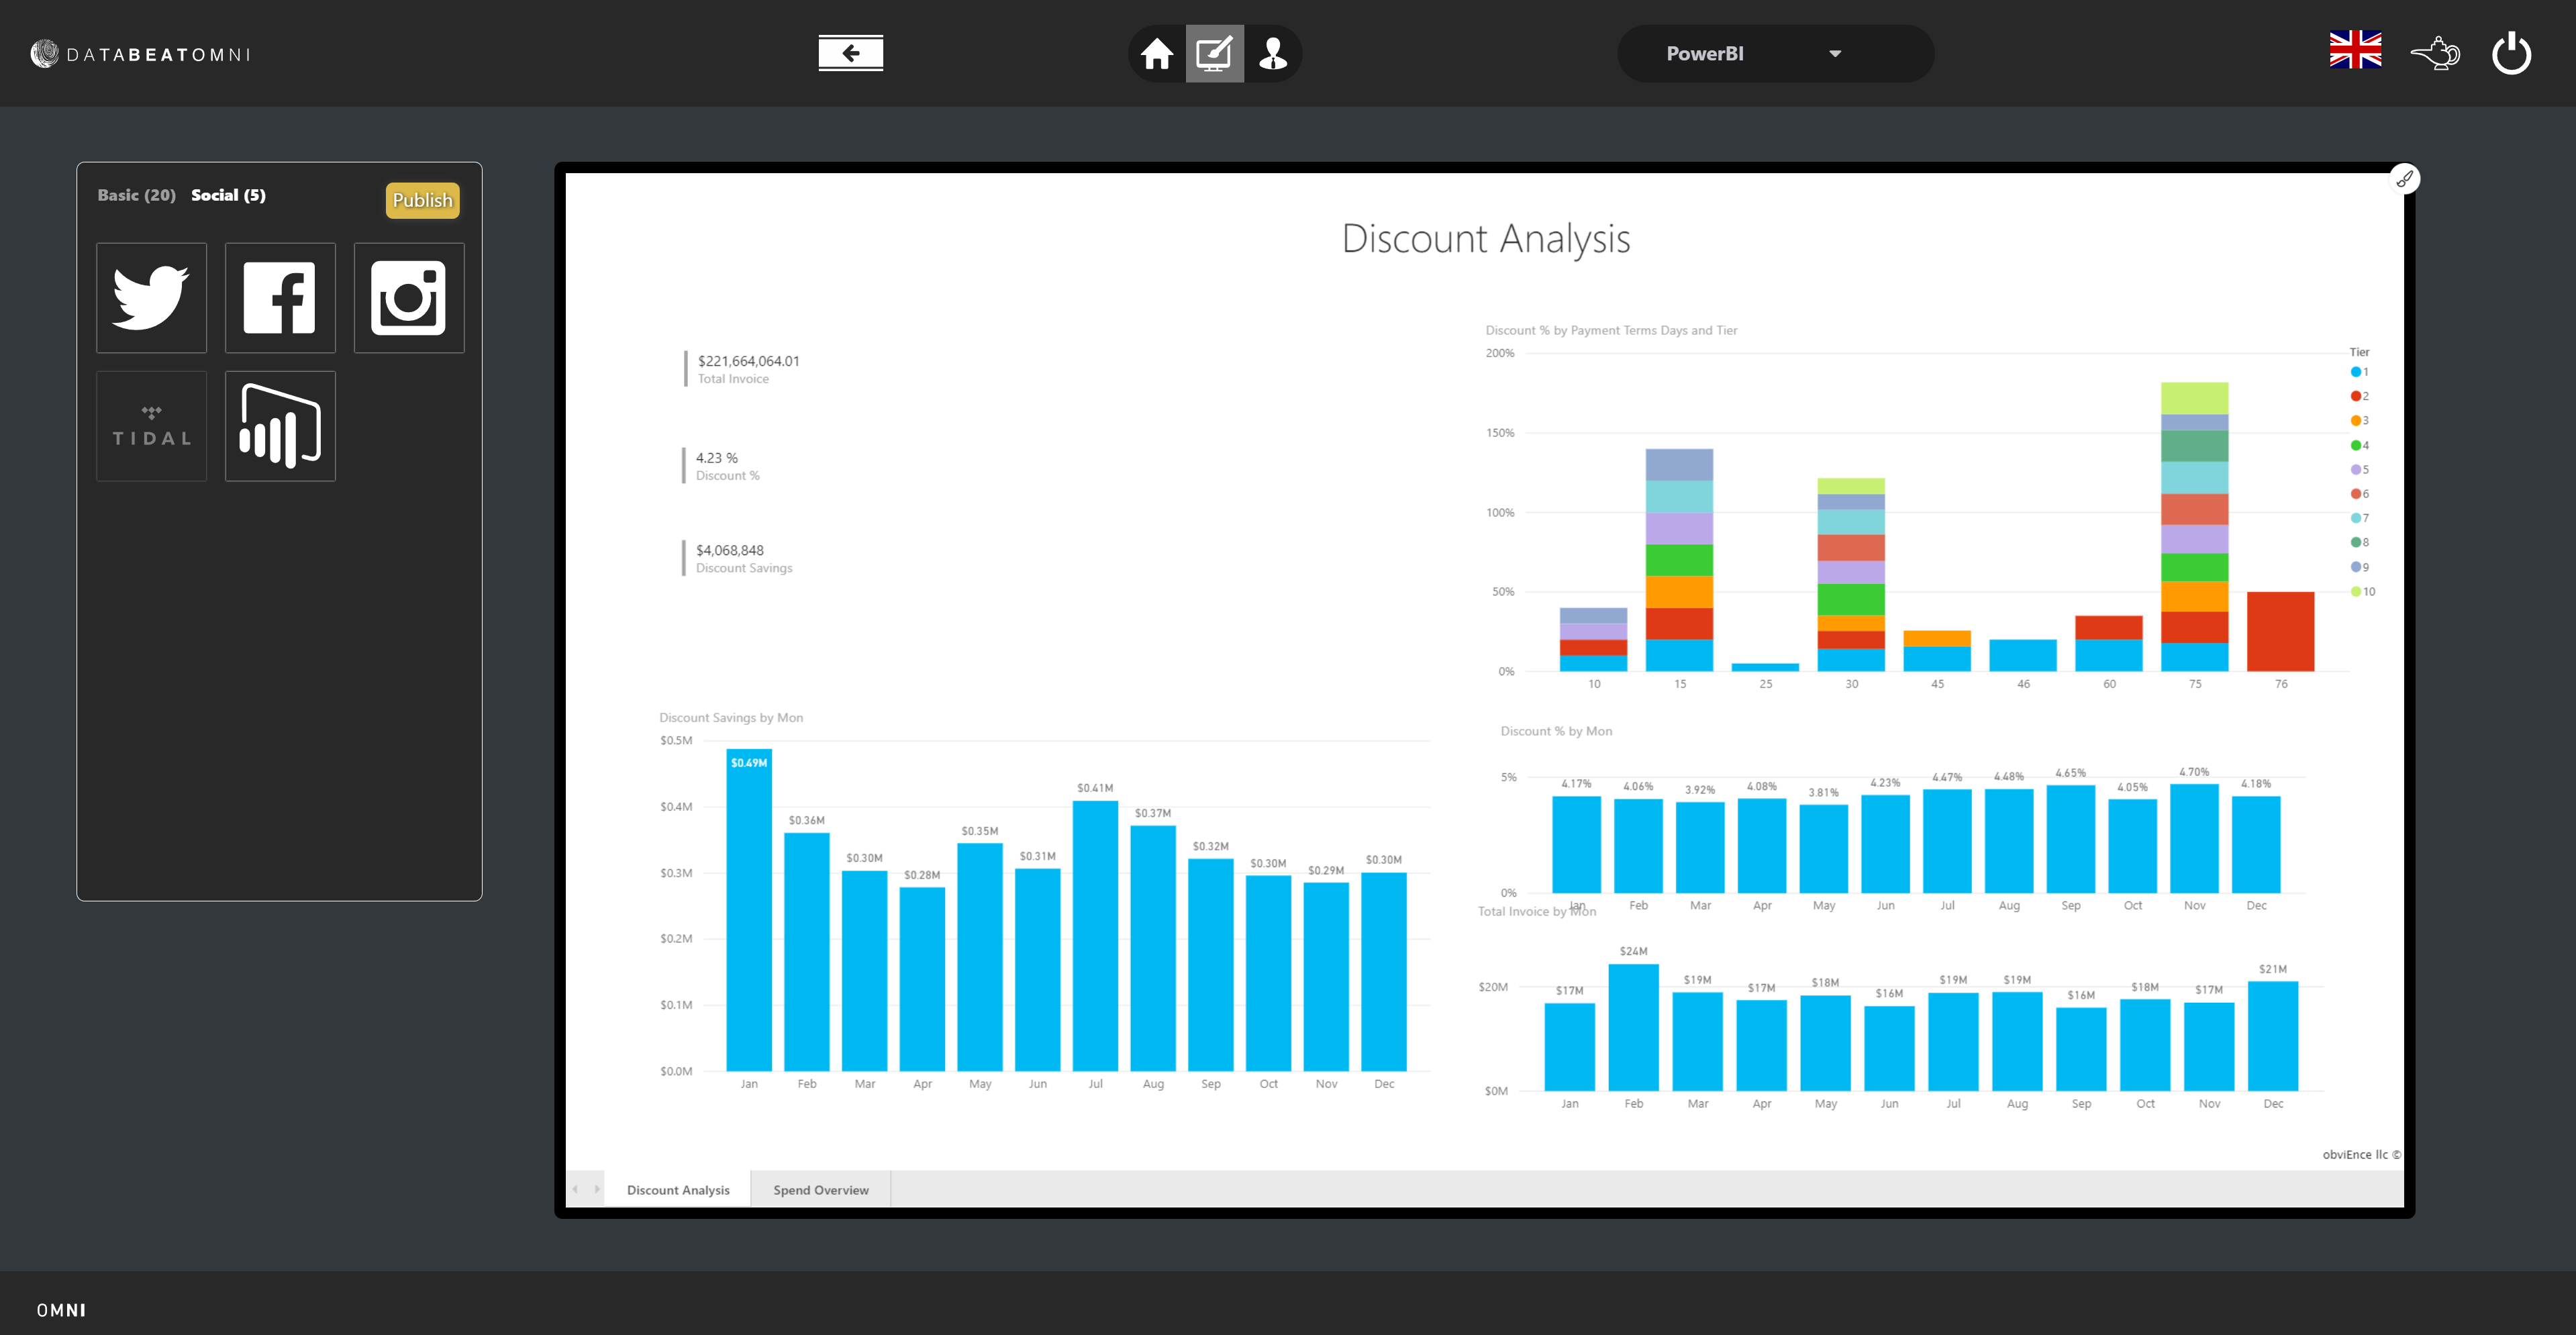
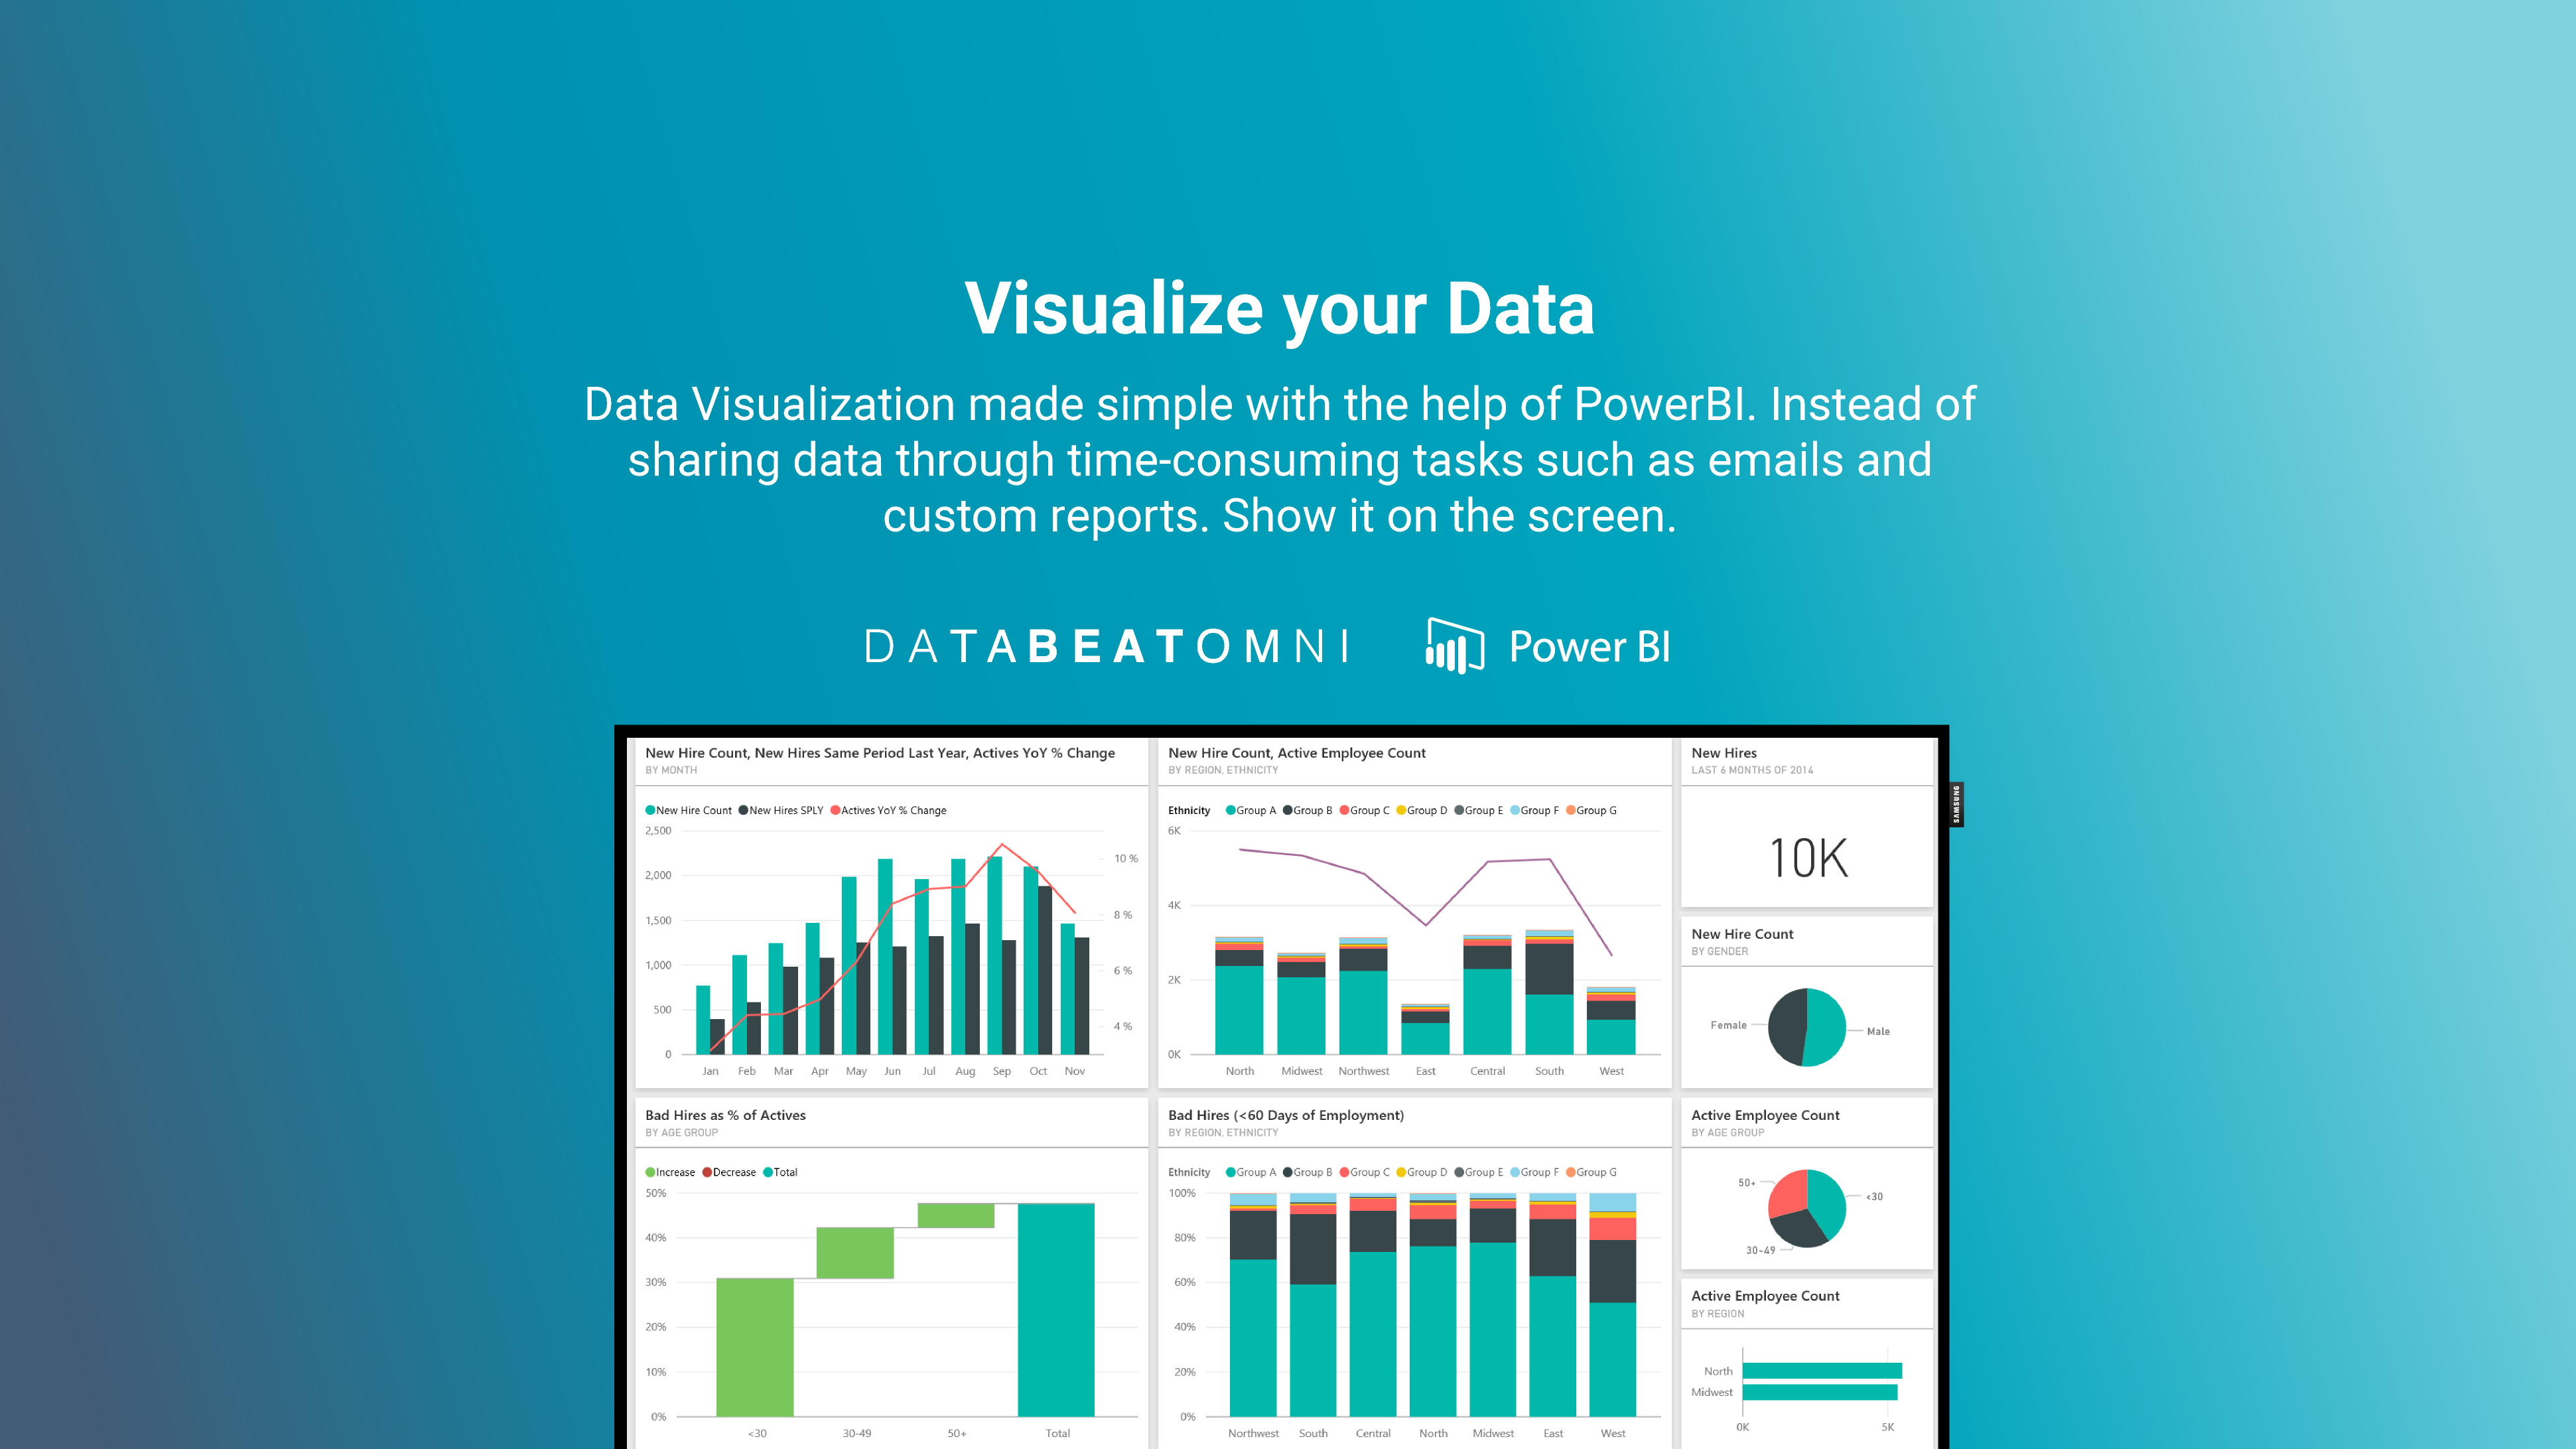
We can proudly announce that we have created a Power BI widget in DatabeatOMNI.
With this widget, you can show reports & dashboards directly onto your digital signage screens. The time of creating reports manually and sending them to stakeholders or sharing the report with the internal teams is over. With the Power BI widget, teams can view their dashboards on a screen that is strategically placed within the workspace.
Some words about Microsoft Power BI
Microsoft Power BI is a business analytics solution that lets you visualize your data and share insights across your organization, or embed them in your app or website. You can connect to hundreds of data sources and bring your data to life with live dashboards and reports.
In a few points this is what you can do with Power BI:
- Transform data into stunning visuals and share them with colleagues on any device.
- Visually explore and analyze data—on-premises and in the cloud—all in one view.
- Collaborate on and share customized dashboards and interactive reports.
- Scale across your organization with built-in governance and world-renowned Microsoft security.
Has established itself as the market leader.
Gartner is a global research and advisory that has created a report called the Gartner’s BI Magic Quadrant. In the past 12 years, they have measured the top business intelligence software providers in the world. Gartner measures these companies based on completeness of vision and ability to execute. Quoting on the report Microsoft Power BI is the established leader in the global market when it comes to business intelligence software.
One of the main reasons why Microsoft has achieved this is because of their vast user community and commitment to incorporate feedback from customers and user alike.
A way to reduce wasted man-hours.
I have gathered some statistics that are worth mentioning in context with the DatabeatOMNI PowerBI widget. According to Salesforce.com, today´s sales professionals spend just 34% of their time selling and 66% on other tasks such as reporting, internal meetings, and unproductive tasks. Data taken from Hubspot says that "an average marketer uses around 247 hours a year on creating marketing reports", a lot of this work is repetitive and does not provide much value for the company.
With the use of Microsoft and our own technology, we have figured out how we can help to reduce wasted reporting hours and keeping true to our cause, which is difficult made simple.
With the DatabeatOMNI Microsoft Power BI widget you can:
- Share your report visualizations direct to your digital screens.
- Update your reports in PowerBI and have the changes automatically sent to screen
- Make your data easy to view, read and understand.
What type of data can I show ?
Not sure what type of data you want to share? Although there is an endless possibility of types of data you can share, here are some suggestions you can start with:
- Sales and Marketing Data
- Financials
- Production Data
- Health & Safety records
- Employee Incentive KPIs
In the image below, you will see a preview of the Power BI widget in action. Want to know how to get started with the Power BI widget? Check out our knowledgebase article.

If you should have any questions on getting started with the DatabeatOMNI Power BI widget, send us an email to support@databeat.net and our support team will gladly be of assistance.


.png)